Control System – Steps for Solving Bode Plots
Bode plot is a graph that represents a system frequency response.It is used to examine the stability of a closed loop control system.These are also known as logarithmic plot (because we draw these plots on semi-log papers) and are used for determining the relative stabilities of the given system.It is usually a mix of a a Bode phase plot, representing the frequency response phase shift and the Bode magnitude plot, depicting the magnitude of the frequency response gain.
We already know that , the system will go into uncontrolled oscillation if its an unstable system(when the mike in an auditorium is pointed or gets too close to a speaker with the resulting loud squeal from the system).Now let’s see the steps required for solving the Bode plots:
- Bring the given G(s)H(s) transfer function into standard time constant form.
- Replace all s by jω to get the frequency domain transfer function.
- Make a table of the standard factors present in the given transfer function.
- Now analyze the table of factors
- Make the table for plot representing the magnitude variation. We can take help of this table to plot the magnitude curve .
- Select proper X and Y scales for the magnitude plot. Draw the lines of the corresponding factors from starting point to the corner frequency ( i.e the End point ).
- Note down the phase angle table and obtain the resultant phase angle by actual calculations.
- Prepare the table (containing phase angle variation) and then obtain resultant phase angle by actual calculation.
- Depending upon the highest frequency term present , choose the starting point in the log scale . Plot the points as per phase angle table and then draw smooth curve for phase angle plot.
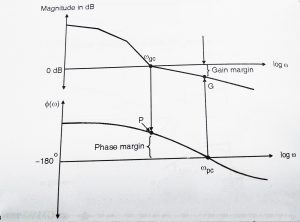
Gain Margin calculations :
- From phase resultant curve find ‘ω’ where phase curve crosses -180
 . This is called the phase crossover frequency i.e
  . Draw the straight line from
  upwards towards the magnitude plot , till it intersect magnitude curve. Call this point as G . The difference between 0 dB and magnitude corresponding to point G is the gain margin.

Phase Margin Calculations :
- From the magnitude resultant curve find where resultant crosses 0 dB . This is gain crossover frequency
 . Draw the straight line from
  downwards till it intersects the phase curve. Call this point as P. The distance between point P and -180
 line is the phase margin.
 - Only if both , gain margin and phase margin are positive , is the system stable i.e
 <
<  .
.
Now we shall see summary of Bode Magnitude and Phase Plots of various terms :
| Sr no. | Factor | Magnitude (M) | Phase(φ) |
| 1 | Constant gain k | 20log|k| dB | Φ = 0 = -180
|
| 2 | Poles at origin (integral) |
Straight line with -20n dB/dec slope and passing through [ω = 1 , 0 dB ] point | Φ = -90n |
| 3 | Zero at origin (derivative) |
Straight line with +20n dB/dec slope and passing through [ω = 1 , 0 dB ] point | Φ = 90n |
| 4 | First order poles |
Line slopes are
1. 0 dB/dec (for ω 2. -20dB/dec (for ω > |
Φ =
( |
| 5 | First order zeros |
Line slopes are
1. 0 dB/dec (for ω 2. 20dB/dec (for ω > |
Φ =
( |
| 6 | Second order poles |
Line slopes are
1. 0 dB/dec (for ω 2. -40dB/dec (for ω > 3. Error detection of ω = |
Φ = |
| 7 | Second order zeros
|
Line slopes are
1. 0 dB/dec (for ω 2. +40 dB/dec (for ω > 3. Error detection of ω = |
Φ = |
Let’s make this topic clear by taking one simple example:
A feedback system has :
G(s)H(s) = ![]() , we need to draw bode plot and comment on stability.
, we need to draw bode plot and comment on stability.
So, here we should follow the required steps as stated earlier in this post,
Step 1 : Bring the given G(s)H(s) transfer function into standard time constant form:
G(s)H(s) = ![]() =
= ![]() =
= ![]() ,
,
Step 2 : Replace all s by jω to get the frequency domain transfer function:
G(jω)H(jω) = ![]()
Step 3 : The following factors are present:
- Constant k = 60
- Pole at origin = 1/ jω
- First order zero = (1 + jω/3)
- First order pole = 1/(1 + jω)
- First order pole = 1/(1 + jω/5)
Step 4 : Prepare table of factors :
| Sr no. | Factor | Magnitude curve | Phase curve |
| 1 | K = 60 | Straight line of 20log60 = 35.5 dB | Φ = 0 |
| 2 | 1/ jω | Slope of -20 dB/dec passing through 0 dB at ω = 1 rad/sec | Φ = -90 |
| 3 | 1/ ( 1 + jω) | Line slopes are
1. 0 dB (ω 2. -20 dB/dec (ω |
|
| 4 | 1/(1 + jω/5) | Line slopes are
1. 0 dB (ω 2. -20 dB/dec (ω |
|
| 5 | 1 + jω/3 | Line slopes are
1. 0 dB (ω 2. -20 dB/dec (ω |
Step 5 : Magnitude plot table
The product of different magnitude appears in any transfer function will be evaluated as the addition, while any division will be further evaluated as the substraction as we are dealing with a logarithmic scale.
| Sr no. | Factors | Resultant slope | Start point (ω) | End point (ω) |
| 1 | k | Straight line of 35.5 dB | 0.1 | ∞ |
| 2 | 1/ jω | -20 dB/dec | 0.1 | 1 |
| 3 | 1/ ( 1 + jω) | -20 + (-20) = -40 dB/dec | 1 | 3 |
| 4 | 1/(1 +jω/5) | -40 + 20 = -20 dB/dec | 3 | 5 |
| 5 | 1 + jω/3 | -20 + (-20) = -40 dB/dec | 5 | ∞ |
Step 6 : Phase plot table:
For phase plot, we compute the angle contribution by individual factors and then add each angle (at given ω) to get resultant phase. Mark these points in semilog paper and draw smooth phase graph.
![]() = -90 –
= -90 – ![]() –
– ![]() +
+ ![]()
| ω | 1/ jω | – |
– |
||
| 0.1 | -90 | -5.7 | -1.1 | 1.9 | -94.9 |
| 0.5 | – 90 | -26.5 | -5.7 | 9.46 | -112.7 |
| 1 | -90 | -45 | -11.3 | 18.4 | -127.9 |
| 5 | – 90 | -78.69 | -45 | 59 | -154.79 |
| 10 | – 90 | -84.3 | -63.4 | 73.3 | -164.4 |
| 100 | – 90 | -89.4 | -87.1 | 88.3 | -178.2 |
| 500 | – 90 | -89.8 | -89.4 | 89.6 | -179.6 |
| 1000 | – 90 | -89.9 | -89.71 | 89.8 | -179.8 |
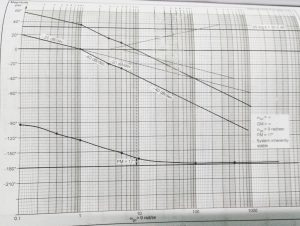
Step 7 : The bode plot is shown in below figure :

It is much evident from the above plot that, by using this plot , we can easily comment on the stability of any controlling process without doing any complex calculations.Bode plots thus represents the relative stability in the form of the phase margin and gain margin.Further it also addresses frequencies ranging from low to high values.Hope you really enjoyed this post.In my next post we will see what a polar plot is and its significance in frequency response analysis.So stay tuned.

Aric is a tech enthusiast , who love to write about the tech related products and ‘How To’ blogs . IT Engineer by profession , right now working in the Automation field in a Software product company . The other hobbies includes singing , trekking and writing blogs .
