Control System – Bode Plot
Bode plot is a frequency domain technique(used in frequency response analysis) in which magnitude and phase are drawn one below the other. Hence we have two graphs,
Graph 1 : The magnitude (M) of the transfer function as a function of frequency (ω) and
Graph 2 : The phase angle (φ) as a function of frequency (ω)
In graph 1 , magnitude of GH (jω) , the open-loop transfer function, is plotted in decibels on the y-axis while the input frequencies are plotted on x-axis .
In graph 2 , phase angle of GH (jω) plotted on y- axis and the x-axis has the input frequencies in the log scale (similar to graph 1).
Both the above characteristics are plotted on a single semilog paper with the same x-axis scale used for both the graphs.
Standard form for GH (jω) :
The frequency transfer function can be written in a generalized form as the ratio of polynomials.
GH(s) = ![]() =
= ![]()
This must be factorized to obtain general type,
GH(s) = ![]()
We convert the above equation in the time constant form,
GH(s) = ![]()
We now put s = jω to convert the transfer function to the frequency domain ,
GH (jω) = ![]()
Here ![]()
- Bode gain
 or constant factor .
 - Poles at origin
 of order k.
 - Zeros at origin
 of order g.
 - Finite simple poles at (1+
 ) or first order poles.
 - Finite simple zeros at (1+
 ) or first order zeros.
 - Second order poles at

- Second order zeros at

Frequency domain Specifications :
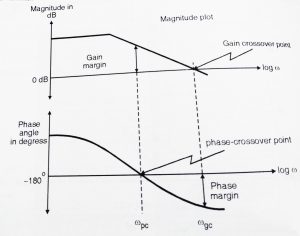
- Gain Margin:
It is a measure of relative stability , higher the gain margin higher will be the stability of the machine and is defined as reciprocal of the open loop transfer function, evaluated at phase crossover frequency ![]() which is the frequency at which the phase is -180
which is the frequency at which the phase is -180![]() . i.e ,
. i.e ,
Gain margin : ![]() where , ∠ GH
where , ∠ GH![]() = -180
= -180![]() ,
,
Where ‘![]() ‘ is the phase crossover frequency.
‘ is the phase crossover frequency.

- Phase margin (
 ) :
) :
Higher the phase margin higher will be the stability of the system .Phase margin is a measure of relative stability and is defined as 180![]() plus the phase angle
plus the phase angle ![]() of the open loop transfer function at unity gain . That is ,
of the open loop transfer function at unity gain . That is ,
![]() = [ 180 + arg GH(
= [ 180 + arg GH(![]() ) ] degrees
) ] degrees
Where | GH(![]() )| = 1 and
)| = 1 and ![]() is the gain cross over frequency as shown in the above figure.
is the gain cross over frequency as shown in the above figure.
- Bandwidth:
The bandwidth of a system is that range of frequencies , over which the system responds satisfactorily. This performance is determined by the application and the characteristics of a particular system.
Often bandwidth of a system defined as a range of frequencies over which the magnitude ratio does not differ by more than – 3 dB from its value at specified frequency. For many feedback control system, this frequency is zero .The bandwidth is in this case equal to cutoff frequency ![]() .
.
- Cutoff frequency (
 ) :
) :
The frequency ‘![]() ‘ at which the magnitude of closed loop response is 3dB below its zero frequency value is called ‘cut off frequency ‘ .
‘ at which the magnitude of closed loop response is 3dB below its zero frequency value is called ‘cut off frequency ‘ .
- Cut off Rate :
The cut off rate is the frequency rate at which the magnitude ratio decreases beyond the cut off frequency ![]() .
.
- Resonance Peak Frequency (
 ) :
) :
The resonance peak ![]() , a measure of relative stability , is the maximum value of the magnitude of the closed loop frequency response.
, a measure of relative stability , is the maximum value of the magnitude of the closed loop frequency response.
- Resonant frequency (
 ) :
) :
The resonant frequency is the frequency at which ‘![]() ‘ occurs .
‘ occurs .
- Gain crossover frequency :
This is the point on the magnitude plot at which the magnitude of GH(jω) is unity. It is measured in terms of frequency.
- Phase margin Angle (
 ) :
) :
This angle is 180![]() plus the negative trigonometrically considered angle of the transfer function at gain crossover frequency.
plus the negative trigonometrically considered angle of the transfer function at gain crossover frequency.
- Phase crossover frequency :
This is the frequency at which the phase of GH is -180![]() .
.
Relative Stability :
The relative stability of a system is indicated by gain margin and the phase margin in terms of the system’s open loop frequency response . Further, these parameters can be easily determined from the Bode plot of GH(jω). In most cases positive gain and phase margin as defined will ensure the stability of the closed-loop system.
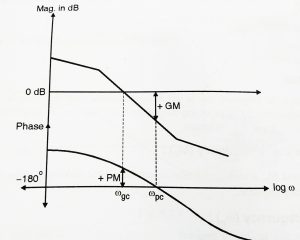
For stable system , ![]() <
< ![]() i.e GM and PM = positive
i.e GM and PM = positive
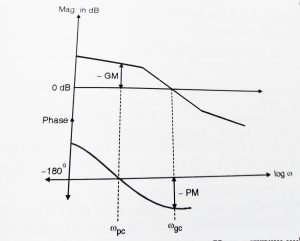
For unstable system , ![]() >
> ![]() i.e GM and PM = negative
i.e GM and PM = negative
Shown below are the different types of stability obtained using Bode plots:
- When both GM and PM are positive

2. when both GM and PM is negative

When GM is +∞ , the system is absolutely stable and when GM and PM both are zero, the system is marginally stable.
In my next post we will see complete steps for solving Bode Plots(along with an example). Meet you all in my next post.

Aric is a tech enthusiast , who love to write about the tech related products and ‘How To’ blogs . IT Engineer by profession , right now working in the Automation field in a Software product company . The other hobbies includes singing , trekking and writing blogs .
