Control System – Polar Plots
In my previous posts, we have seen how a system is represented in the frequency domain by replacing s by jω and the implementation of ‘Bode plots‘ for frequency response analysis. In Bode plots, the magnitude and the phase were drawn separately on a semilog paper.
In Polar and Nyquist plots we plot the magnitude and phase using polar coordinates. Each point on the polar plot is a phasor of magnitude M and phase angle ‘φ’. The distance from the origin is proportional to magnitude G(jω) i.e |G(jω)| and the angle represents the phase of G(jω) i.e ∠ G(jω) .
Now let us see some of the advantages of Polar plots:
It depicts the frequency response characteristics over the entire frequency range in a single plot.(there is single graph to represent both phase and magnitude , unlike in Bode plot).
Much easier to determine both ![]() and
and ![]() .
.
Here we will have to work with open loop transfer function G(s)H(s) (and not with closed loop transfer function and unlike Bode plot we need not required to convert G(s)H(s) to the time constant form).
Now we will take examples to understand the use of Polar plots for analysis,
Polar Plot of a 1st Order Pole (![]() ) :
) :
So, we need to draw polar plot of the given transfer function G(s)H(s) = ![]()
Step 1 : The first step would be to convert this transfer function to the frequency domain.
This can be done by converting ‘s’ by ‘jω’
G(jω)H(jω) = ![]() ,
,
Step 2 : We now find the magnitude and phase
|G(jω)H(jω)| = ![]()
∠ G(jω)H(jω) = ![]() =
= ![]()
∠ G(jω)H(jω) = ![]()
Step 3 : Vary ‘ω’ from 0 to ∞
Now instead of taking different values of ω, we simply take two extreme values of ω i.e ω = 0 and ω = ∞
At ω = 0, |G(jω)H(jω)| = ![]() = 5
= 5
∠ G(jω)H(jω) = ![]() = 0
= 0![]()
At ω = ∞ , |G(jω)H(jω)| = ![]() = 0
= 0
∠ G(jω)H(jω) = ![]() = -90
= -90![]()
Now these two points are sufficient to draw the polar plot. At ω = 0 since the magnitude is +5 and angle is 0,we draw it on the right-side horizontal axis. At ω = ∞ , the magnitude is 0 while angle is -90![]() , hence we draw it as dot(zero magnitude) on the -90
, hence we draw it as dot(zero magnitude) on the -90![]() axis. The direction is represented by an arrow(refer below diagram) .
axis. The direction is represented by an arrow(refer below diagram) .
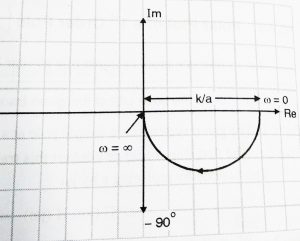
We can now generalize that the polar plot of a 1st order pole (![]() ) will always have a shape shown above.
) will always have a shape shown above.
Effect of adding more Simple Poles:
Let us add one more simple pole to above example,
Then we have, G(s)H(s) = ![]()
The given system has two poles i.e s = -2 and s = -4 ,
Step 1 : The first step would be convert this transfer function to the frequency domain.
This can be done by converting ‘s’ by ‘jω’
G(jω)H(jω) = ![]()
We don’t need to convert this to time constant form.
Step 2 : We now find the magnitude and phase
|G(jω)H(jω)| = ![]() ,
,
∠ G(jω)H(jω) = ![]() =
= ![]()
∠ G(jω)H(jω) = ![]()
Step 3 : Vary ‘ω’ from 0 to ∞
Now instead of taking different values of ω, we simply take two extreme values of ω i.e ω = 0 and ω = ∞
At ω = 0, |G(jω)H(jω)| = ![]() = 1.25
= 1.25
∠ G(jω)H(jω) = ![]() = 0
= 0![]() ,
,
At ω = ∞ , |G(jω)H(jω)| = ![]() = 0
= 0
∠ G(jω)H(jω) = ![]() = -90
= -90![]() -90
-90![]() = -180
= -180![]()
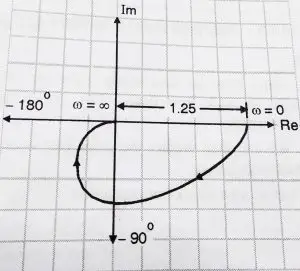
From the above two point now we can draw the polar plots,
We can note here that the starting and ending pint will not change as long as system has two simple poles on the LHP. Thus, we can generalize that G(jω)H(jω) = ![]() will have a polar plot as shown below:
will have a polar plot as shown below:
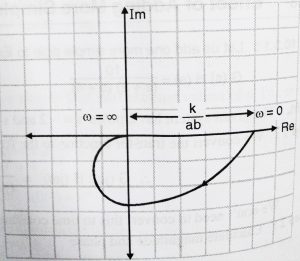
From comparing both the above polar plots, we can make an important conclusion that, the addition of simple pole to system stretches the polar plot by -90![]() .
.
Effect of adding pole at origin:
Now we shall see what happens when we add pole at origin,
Now we have, G(s)H(s) = ![]()
The given system has two poles i.e s = -2 and s = 0 ,
Step 1 : The first step would be convert this transfer function to the frequency domain.
This can be done by converting ‘s’ by ‘jω’
G(jω)H(jω) = ![]()
We don’t need to convert this to time constant form.
Step 2 : We now find the magnitude and phase
|G(jω)H(jω)| = ![]() ,
,
∠ G(jω)H(jω) = ![]() =
= ![]()
∠ G(jω)H(jω) = ![]() – 90
– 90![]()
Step 3 : Vary ‘ω’ from 0 to ∞
Now instead of taking different values of ω, we simply take two extreme values of ω i.e ω = 0 and ω = ∞
At ω = 0, |G(jω)H(jω)| = ![]() =
= ![]() ,
,
∠ G(jω)H(jω) = ![]() – 90
– 90![]() = – 90
= – 90![]() ,
,
At ω = ∞ , |G(jω)H(jω)| = ![]() 0
0
∠ G(jω)H(jω) = ![]() – 90
– 90![]() = -90
= -90![]() – 90
– 90![]() = – 180
= – 180![]()
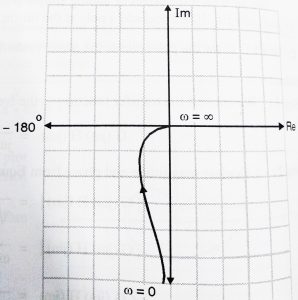
From the above two points now we can draw the polar plot,
We can note here that the at ‘ω’ = 0 , magnitude is ∞ , we draw line parallel to the -90![]() axis assuming it will touch -90
axis assuming it will touch -90![]() axis at ∞.
axis at ∞.
We note that adding a pole at the origin:
- Shifts the polar plot by -90
 at ω = 0 and
 - Magnitude at ω = 0 becomes infinity
What will happen if two poles present at the origin?
As expected the polar plot will get shifted by -180![]() (since two poles present at origin)
(since two poles present at origin)
So we have seen effect of addition of poles to the system, so what will be the effect of addition of zeros?
Result of addition of zeros is exactly opposite to that of poles. A pole adds -90![]() to the plot, while a zero adds +90
to the plot, while a zero adds +90![]() to the polar plot.
to the polar plot.
Stability on Polar plots:
We can check stability using polar plot in very simple manner. Imagine yourself walking on the polar plot, along the direction of the arrow i.e from = 0 to ∞ . The entire area to the right of you upto the real axis represented by an infinite radius is said to be enclosed by the polar plot.
The portion inside the shaded area is said to be enclosed by the polar plot. A system is stable if the (-1,0) point is not enclosed by the polar plot.
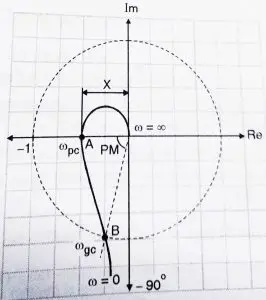
Polar plots are simple method to check the stability of the system. They are however not the preferred choice when the system has poles on the right half plane.(In such cases we use Nyquist plots which are an extension of polar plots and will be seen in my next post.So stay tuned…)

Aric is a tech enthusiast , who love to write about the tech related products and ‘How To’ blogs . IT Engineer by profession , right now working in the Automation field in a Software product company . The other hobbies includes singing , trekking and writing blogs .
