Control System – Nyquist plot
In my previous post we saw how to analyze a system using polar plot. Now we need to learn about Nyquist plot (which is basically an extension of the polar plot).
The ‘Nyquist plot’ method handles systems with time delay without the necessity of approximations and give an exact result about both absolute and relative stability of the system. Now , we should learn one important concept i.e ‘principle of argument’.
If let say ‘p’ poles and ‘z’ zeros of q(s) are confined by the s-plane contour, then the q(s) plane contour must enclose the origin ‘z’ times in the clockwise direction and ‘p’ times in the anti-clockwise direction (since generally p > z).
This relationship between the enclosure of poles and zeros by the s-plane contour (an enclosed path in a complex plane is known as a contour) and the encirclement of the origin by the q(S) plane contour is known as ‘principles of argument’ . We should know the following terms before we look into the steps to solve problems.
Encirclement:
Any specific point is declared to be encircled by a closed path if it lies inside the closed path.
Mapping theorem:
For any closed-loop system to be stable , the Nyquist plot of G(s)H(s) should encircle the point -1+ j0 as many times as the number of poles G(s)H(s) that are in the right half of s plane.
Number of encirclements is given as :
N = P – Z
Where N = number of encirclement of point -1 + j0
P = Number of poles G(s)H(s) that are on right half of s plane
Z = Number of zeros G(s) H(s)
For stability of closed loop, Z should be zero , i.e N = P
Nyquist plot analysis:
Pole – zero configuration
Consider closed loop transfer function ![]() as
as
![]()
Poles of 1+ G(s)H(s) = open loop poles of a system
Zeros of 1 + G(s)H(s) = Closed loop poles of a system
From Nyquist point of view, the system is absolutely stable if all zeros of 1 + G(s)H(s) , i.e closed loop poles of the system are located in the left half of s plane.
Steps to solving problems:
Count how many number of poles of G(s)H(s) are on the right half of s – plane.
Decide the stability criterion as N = -P i.e how many times Nyquist plot should encircle -1 + j0 point for absolute stability .
Select Nyquist path as per the function G(s)H(s) .
Analyze the sections as a starting point and terminating point .
Mathematically find out and the intersection of Nyquist plot with a negative real axis by rationalizing G(j![]() )H(j
)H(j![]()
With the knowledge of steps 4 and 5 , sketch the Nyquist plot
Count the number of encirclements N of -1 + j0 by Nyquist plot . If this matches the criterion decided in step 2, system is stable otherwise unstable.
After plotting the Nyquist plot, we can then obtain the absolute stability of this loop that is a closed control process implementing the Nyquist stability criterion. Then the given closed-loop controller process is completely stable if the critical point that is the point -1+j0 falls outside the enclosure.
Now we should look into one simple example to understand this topic in a lucid manner.
Given G(s)H(S) = ![]() , comment on the stability using Nyquist plot.
, comment on the stability using Nyquist plot.
Step 1 : Position of poles , s = -1
Hence, there are no poles in the right half plane(RHP)
Thus, P = 0
Hence for stability , number of encirclements in the anticlockwise direction about the (-1 + 0j) point should be zero, i.e N = 0 . We need to check if we get N = 0.
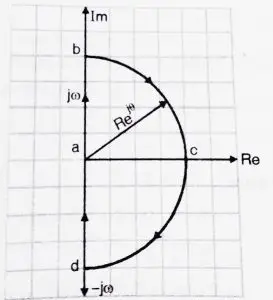
Step 2 : The Nyquist contour is shown below, this encloses entire left half plane. The Nyquist paths are
- Path a – b s = jω ,
- Path b – c – d s =
 -90
-90  θ
θ  90 ,
90 , - Path d – a s = – jω ,
We shall draw each path.

Step 3 : Path a – b
Here s = jω , this path is the same as the polar plot,
G(s)H(S) = ![]() ,
,
Now we have to convert ‘s’ by ‘jω’ ,
G(jω)H(jω) = ![]()
We now find the magnitude and phase
|G(jω)H(jω)| = ![]()
∠ G(jω)H(jω) = ![]() =
= ![]() ,
,
∠ G(jω)H(jω) = –![]() ,
,
Vary ‘ω’ from 0 to ∞
Now instead of taking various values for ‘ω’ ,we can easily consider the two extreme values of ω i.e ω = 0 and ω = ∞
At ω = 0, |G(jω)H(jω)| = 1
∠ G(jω)H(jω) = –![]() = 0 ,
= 0 ,
At ω = ∞ , |G(jω)H(jω)| = 0 ,
∠ G(jω)H(jω) = –![]() = -90 ,
= -90 ,
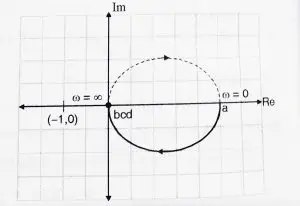
The polar plot is shown below,
Step 4 : Path b – c – d
Here s = ![]() ,
,
Hence, G(s)H(s) = ![]() ,
,
Since R is ∞ , |G(jω)H(jω)| = 0 for all values
|G(jω)H(jω)| = ![]() = 0 ,
= 0 ,
Since magnitude is 0, no use of finding the angle values. Therefore, path b – c- d maps on to the center.
( Note : as long as system has more poles , section b – c – d will always be 0)
Step 5 : Path d – a
Here s = -jω ,
This is the mirror image of path a – b , hence the final Nyquist plot is shown below.

Since there are no encirclements about the (-1 + 0j) point.
N = 0
We know, N = P – Z
0 = 0 – Z ( since P = 0)
Hence , Z = 0
Z = 0 implies that there are no zeros of q(s) (no poles of the characteristic equation) lying on the Right half plane . Hence the system is stable.
Nyquist stability criterion : It states that the value of N = Z – P. Where, ‘N’ is simply the total number of the encirclements about the center point i.e the origin, ‘Z’ is the total number of zeroes and ‘P’ is total number of the poles.
Case 1 : If the value of ‘N’ is equal to ‘0’ (no encirclement), so Z = P = 0 and Z = P
If N = 0, P must be zero hence the system is said to be stable.
Case 2 : If value of ‘N’ is less than ‘0’ (counter clockwise encirclement), so Z = 0, P ≠0 and P > Z
System is stable.
Case 3 : If the value of ‘N’ is greater than ‘0’ (clockwise encirclement), so P = 0, Z ≠0 and Z > P
For both cases system is said to be unstable.
Let us now see some of the advantages of using Nyquist plots:
- The stability of closed-loop system with a pure time delay can be studied using Nyquist plot.
- It provides information about the absolute stability and also the relative stability.
- We can determine stability of closed-loop system from open-loop transfer function without knowing the roots of the characteristic equation.
- Frequency domain characteristics can be easily obtained(easy to design hence much faster)
Hope you really enjoyed this post, see you soon in my next post.

Aric is a tech enthusiast , who love to write about the tech related products and ‘How To’ blogs . IT Engineer by profession , right now working in the Automation field in a Software product company . The other hobbies includes singing , trekking and writing blogs .
