Control System – Frequency Response Analysis
We have learned the time response analysis in detail (in my series of previous posts) , in which we subjected a system to various inputs i.e step, ramp, parabolic etc.
All those inputs were functions of time ( and not frequency).By frequency response , we mean the steady-state response of a system when subjected to a sinusoidal input.In this method, we vary the input frequency over a certain range and study the resulting response.
Consider a linear system , we subject a sinusoidal input to this system (which is linear),
r(t) = A sin (![]() t) ,
t) ,
Under steady state, the output of the system c(t) will be of the form : c(t) = B sin (![]() t + φ ) ,
t + φ ) ,
In other words, when a sinusoidal input is fed to a linear system , the output of the system is also a sinusoidal signal of the same frequency but different in magnitude and phase.The magnitude and phase relationship between the sinusoidal input and the steady state output is known as the frequency response.
Methods used in Frequency response :
We have two plots : Magnitude and phase plots. In both these the variable is the angular frequency ‘![]() ‘ . The following techniques are used widely:
‘ . The following techniques are used widely:
- Bode Plots: There are two separate plots : (i) Magnitude (ii) Phase , both versus frequency
 in logarithmic value.
 - Polar and Nyquists plots : It is a single plot of magnitude versus phase angle as ω is varied from zero to infinity in polar co-ordinates.
Disadvantages of Frequency Response methods :
- The methods which are considered for obtaining frequency response are outdated as compared to extensive methods developed for modelling and simulations.
- These techniques are basically applied to linear systems.
Derivation of Resonant frequency and Resonant Peak frequency
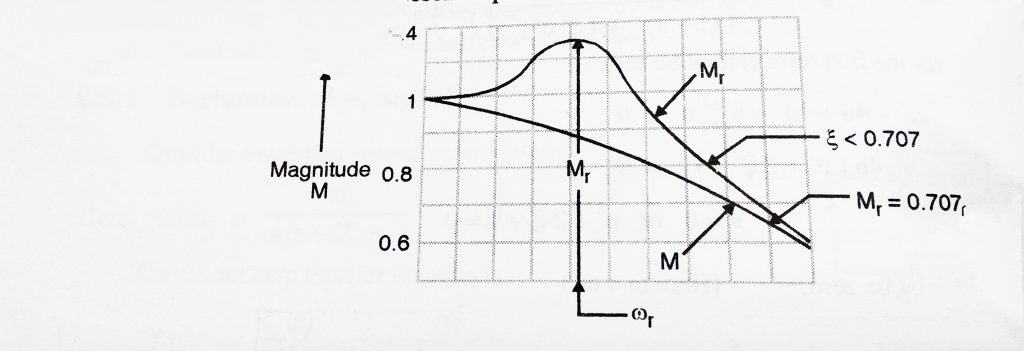
The two important specifications of frequency response are Resonant peak (![]()
Consider a standard second order system .
Here, G(s) = ![]()
The closed loop transfer function is
T(s) = C(s)/R(s) = ![]()
We convert the equation to the frequency response by replacing s by j![]() ,
,
Hence, T(j![]() ) = C(j
) = C(j![]() )/R(j
)/R(j![]() ) =
) = ![]() ,
,
Dividing numerator and denominator by ![]() , and combining the real parts,
, and combining the real parts,
C(j![]() )/R(j
)/R(j![]() ) =
) = ![]() ( by letting
( by letting ![]() = u ) ,
= u ) ,
This term is complex and hence has magnitude and phase ,
Magnitude (M) = ![]() ,
,
We know that resonant frequency at ![]() , magnitude is maximum . Using maxima theorem of derivatives, we get the maximum magnitude when,
, magnitude is maximum . Using maxima theorem of derivatives, we get the maximum magnitude when,
![]() = 0 ,
= 0 ,
![]() =
= ![]() = 0 ,
= 0 ,
![]() = [ (-1/2)
= [ (-1/2)![]() ] [
] [![]() ] = 0
] = 0
Of the two terms , the first term cannot be zero.
Hence, ![]() = 0 ,
= 0 ,
On solving, we get u = 0 or ![]() = 0
= 0
Now, ![]() = u cannot be zero,
= u cannot be zero,
So, ![]() = 0 ,
= 0 ,
Hence , u = ![]() ,
,
Again ![]() = u > 0 ,
= u > 0 ,
So, u = ![]() , Also
, Also ![]() = u =
= u = ![]() ,
,
Then ![]() =
= ![]() ( here we have,
( here we have, ![]() )
)
Hence , ![]() =
= ![]() = Resonating Frequency
= Resonating Frequency
Now, Resonant peak can be easily found out by substituting the value of u in the equation of M,
We know M = ![]()
![]() =
= ![]()
![]() on putting the value of ‘u’ ,
on putting the value of ‘u’ ,
Thus , on solving, we get
![]() =
= ![]() ,
,
From the equations of both i.e ![]() and
and ![]() , it can be concluded that:
, it can be concluded that:
- As ‘
 ‘ approaches to zero ,
  approaches to ∞ (infinity) and
  approaches
  .
. - For 0 <
 < 0.707 ,
  is greater than 1, and
  <
<  .
. - For
 > 0.707 , there is no resonant peak.

Bandwidth:
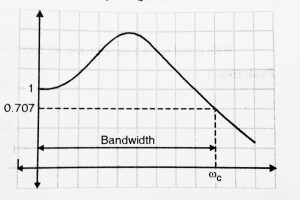
Apart from resonance frequency and Resonant peak , there is one more specification in the frequency response which is extremely important – bandwidth.
It is the range of frequencies upto the cutoff frequency (![]() ) beyond which the magnitude ( M ) drops down by 3 db ( 0.707) below zero frequency level. Let us derive formula for Bandwidth.From above derivation we can directly write the value of magnitude ‘M’ :
) beyond which the magnitude ( M ) drops down by 3 db ( 0.707) below zero frequency level. Let us derive formula for Bandwidth.From above derivation we can directly write the value of magnitude ‘M’ :
Magnitude (M) = |T(j![]() )| =
)| = ![]() ,
,
Now for |T(j![]() )|, a drop by 3 dB is calculated as shown below:
)|, a drop by 3 dB is calculated as shown below:
20 log|T(j![]() )| = -3 ,
)| = -3 ,
20log [![]() ] = -3 ,
] = -3 ,
-20 log (![]() ) = -3
) = -3
On solving, by taking antilog both sides,
![]() = 1.995 ( can be round off to 2 )
= 1.995 ( can be round off to 2 )
![]() = 0
= 0
Taking roots,(using quadratic formula),
![]()
We take square root both the sides,
u = ![]() (since u > 0 , we take only positive value)
(since u > 0 , we take only positive value)
Now u = ![]() =
= ![]() ,
,
![]() =
= ![]() ,
,
Here ![]() is the cut off frequency . Hence the Bandwidth is 0 –
is the cut off frequency . Hence the Bandwidth is 0 – ![]() .
.

Thus Frequency Response of a controller method clarifies the nature of the process when signals are put into it. So we generally do it by analyzing the ‘magnitude’ and ‘phase’separately. The magnitude response of a machine will provide us a concept of this gain/attenuation the system exerts to a specified frequency.
The stage response informs us by how much a Specific frequency Part of the signal May Be delayed/advanced from the system. In my next post, we will see various methods to analyze the frequency response of any system in detail. First we will learn ‘Bode Plot’ technique followed by polar and Nyquist plot.So stay tuned.

Aric is a tech enthusiast , who love to write about the tech related products and ‘How To’ blogs . IT Engineer by profession , right now working in the Automation field in a Software product company . The other hobbies includes singing , trekking and writing blogs .
