How To Find Domain And Range Graphically – Step By Step Guide !!
We have seen all the different methods to find domain and range of a function in the last post of this series . Now it’s time to learn the smart way to find the domain and range of any function graphically .
In order to find domain and range of a graph , you have to learn the basics of plotting graph of any basic maths function . In this post, we’ll explore all the steps required to obtain domain and range of any given function quickly using a graph .
Initially, we’ll discuss the most common occurring standard real functions in the study of calculus . Also now let’s see the standard procedure that you need to follow in any problem involving graphs .
How to Find Domain And Range Of A Graph ?
Steps to be followed to find domain and range of a function graphically :
- Plot the graph of f(x) i.e. y = f(x) , for this you need to have the knowledge of graphs of basic maths functions
- In any graph, we can have Domain as all the x – coordinate values (along x-axis) of the graph
- And Range is all y – coordinate values (along y-axis) of the graph
- Lastly we need to include/exclude the endpoints in the interval carefully by looking at the graph (for which f(x) is a valid function).
Now the above set of steps is valid for any function involving graphs . If you already have a graph handy with you , then just go ahead and solve for domain and range (following step 2 onwards from above)
It’s time to now dig deep into each of the common functions and see how the range and domain look like indeed .
How To Find Domain And Range Graphically ?
As seen above, the first step is to plot the graph of f(x) . Here the foremost point is to know how a graph looks like for any given real-valued function. Now we gonna plot the graph of all commonly used functions and will see the domain and range in each specific case .
Always remember that in order to plot any random graph , you need to plot the coordinates in the cartesian plane that comprises four quadrants. In each quadrant, the value of the x-axis and y-axis will differ (either negative / positive) .
In order to make the plotting of f(x) simpler, you can just start plotting the x and y coordinates (of few test points) on the number line initially (to get the rough idea of the shape of the graph . ).
So if we have the point (x,f(x)) , then start with the point (0,f(0)) , (1,f(1)) , and finally find the roots of f(x) . Plot the same on graph . So without wasting any further time let’s understand the graph of commonly used functions for your ready reference.
Domain And Range Of Constant Function Graph !!
Let’s start with the simple function first . So a constant function is basically a real number , which can be given as :
f(x) = k …. for all x ∈ R
Here f(x) is called a constant function . Graphically this can be represented as :
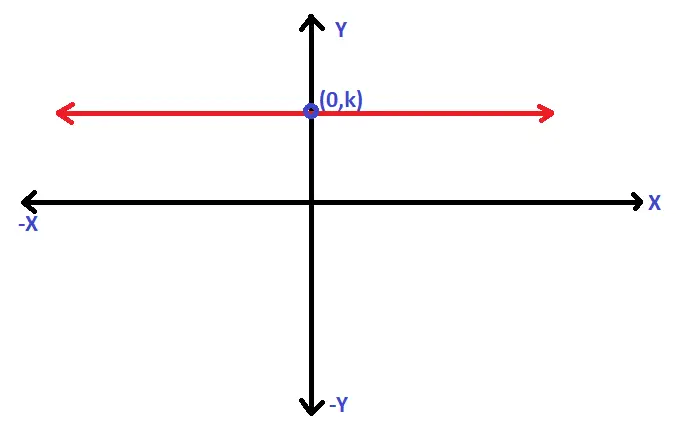
Clearly the graph will be a straight line running parallel to the x-axis (above/below the x-axis based upon the sign of ‘k’). If k = 0 , it will then coincident to x-axis .
For finding the domain of any graph we’ll start moving from the left to right direction (and see the starting and end of the graph along the x-axis) . Based upon this we’ll declare the domain of the graph .
For finding the range of the graph we’ll start moving from the Downward towards the Upward direction (and see the starting and end of the graph along the y-axis). Based upon this we’ll declare the range of the graph .
Since a constant function has no endpoint and it runs towards infinity. Based upon these two conditions, we can easily say that the domain of f(x) is R (all real values on the number line)
Also, the range of f(x) is also R (all real values i.e. -∞ to ∞ on the number line)
Hopefully, you have understood the process of finding domain and range from graph . Before we move over to the next function , let’s recap the definition of domain and range of a function .
Domain basically means , all the values of ‘x’ that the function f(x) can accept (possible input values of ‘x’) and Range is defined as the value of the function that will be obtained on putting the value of ‘x’ . (all output values of f(x))
Domain And Range Of An Identity Function Graph !!
Now it’s time to understand the Identity function . So an identity function is basically a function that associates each real number to itself , this can be given as :
I(x) = x …. for all x ∈ R
Here I(x) is called an Identity function . Graphically this can be represented as :
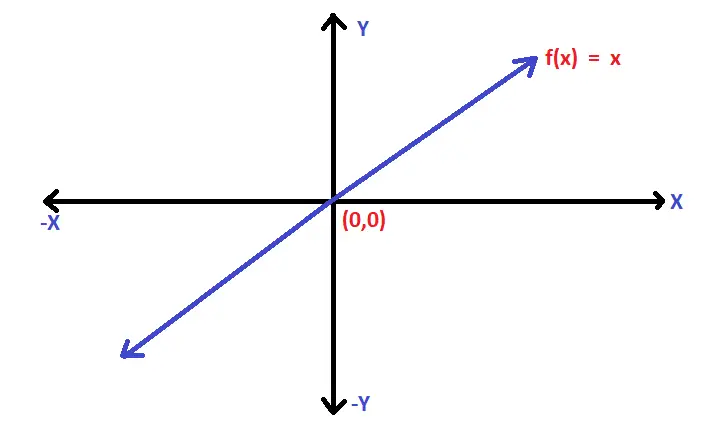
Clearly the graph will be a straight line running through the origin (and inclined at 45° with the x-axis).
For finding the domain of any graph we’ll start moving from the left to right direction (and see the starting and end of the graph along the x-axis) . Based upon this we’ll declare the domain of the graph .
For finding the range of the graph we’ll start moving from the Downward towards the Upward direction (and see the starting and end of the graph along the y-axis). Based upon this we’ll declare the range of the graph .
Since an identity function has no endpoint and it runs towards infinity. Based upon these two conditions, we can easily say that the domain of f(x) is R (all real values on the number line)
Also, the range of f(x) is also R (all real values i.e. -∞ to ∞ on the number line)
Domain And Range Of Modulus Function Graph !!
Now it’s time to understand the Modulus function . So a Modulus function is basically a function that can be given as :
Then f(x) = |x| = x …. when x ≥ 0 ;
Also , f(x) = |x| = -x …. when x ≤ 0 ;
Here f(x) is called a Modulus function . Graphically this can be represented as :
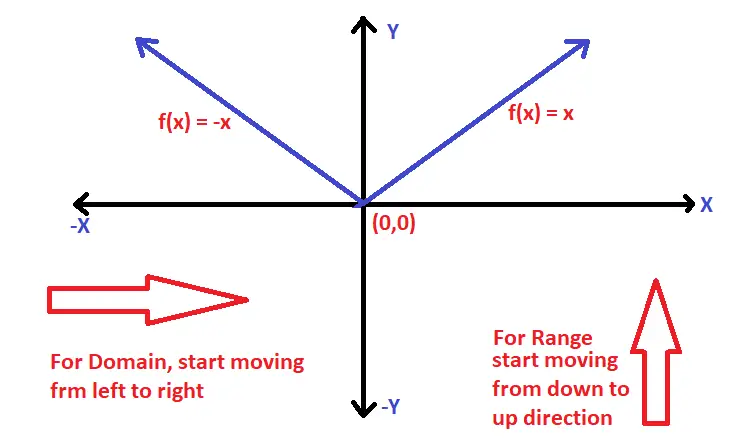
Clearly the graph will be a straight line running through the origin (and inclined at 45° with the x-axis) and then again a straight line running through the origin (and inclined at 45° with the x-axis) on the other side . (a mirror image indeed)
For finding the domain of any graph we’ll start moving from the left to right direction (and see the starting and end of the graph along the x-axis) . Based upon this we’ll declare the domain of the graph .
For finding the range of the graph we’ll start moving from the Downward towards the Upward direction (and see the starting and end of the graph along the y-axis). Based upon this we’ll declare the range of the graph .
Since an identity function has no endpoint and it runs towards infinity. Based upon these two conditions, we can easily say that the domain of f(x) is R (all real values on the number line)
Also, the range of f(x) is all positive values of R (all real values i.e. -∞ to ∞ on the number line)
Range of modulus function = positive values of R i.e {x ∈ R : x ≥ 0}
Domain And Range Of Greatest Integer Function Using Graph !!
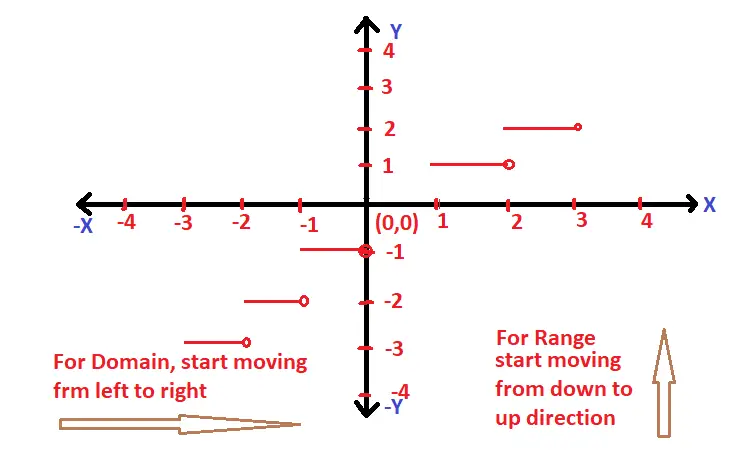
For any real number ‘x’ , we use the symbol [x] to denote the greatest integer function (GIF). Further we can define a GIF function as the greatest integer less than or equal to ‘x’ i.e.
The function f : R → R defined by
f(x) = [x] for all x ∈ R
For ex : [1.76] = 1 , [7.45] = 7 , [-6.87] = -7 etc
GIF is also called as the Step function . Also if we plot the graph of GIF , clearly we can say that the domain of f(x) is set of all R (all real numbers on the number line) . The range can be computed graphically as set of all integers i.e. ‘Z’ .
The range is set of all integer values .
Domain And Range Of Smallest Integer Function Using Graph !!
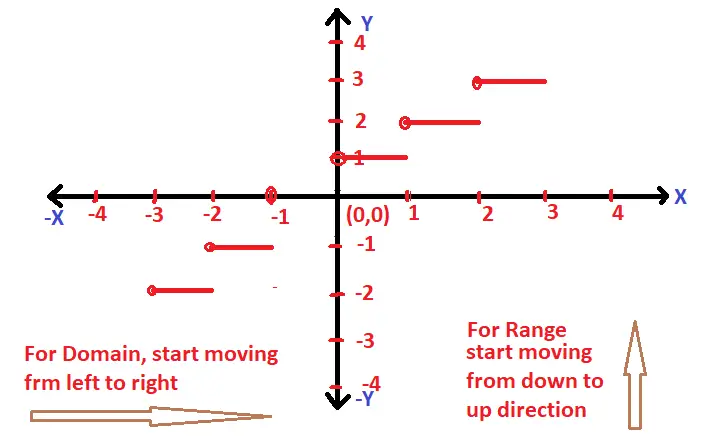
For any real number ‘x’ , we use the symbol [x] to denote the greatest integer function (GIF). Further we can define a GIF function as the smallest integer greater than or equal to ‘x’ i.e.
The function f : R → R defined by
f(x) = [x] for all x ∈ R
For ex : [1.76] = 2 , [7.45] = 8 , [-6.87] = -6 etc
GIF is also called as the Ceiling function . Also if we plot the graph of GIF , clearly we can say that the domain of f(x) is set of all R (all real numbers on the number line) . The range can be computed graphically as the set of all integers i.e. Z
The range is set of all integer values .
Domain And Range Of Signum Function Using Graph !!
Signum function is one of the simplest functions having a well defined constant value of 1 . The function f can be defined as the below predefined conditions :
i.e. f(x) = |x|/x x ≠ 0 ; ….. (the value of f(x) is 1 for x > 0 and -1 for x < 0)
And , f(x) = 0 , x = 0 ;
If we plot these conditions in graph , we can clearly see the domain and range values . For domain , just start moving from the left side towards the right side .
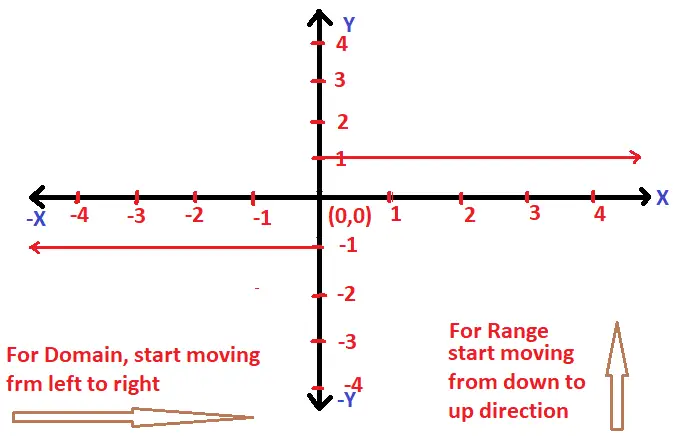
So now , Domain of f(x) = R (all values on the number line) ;
And Range of f(x) = {-1 ,0 , 1}
Domain And Range Of An Exponential Function Using Graph !!
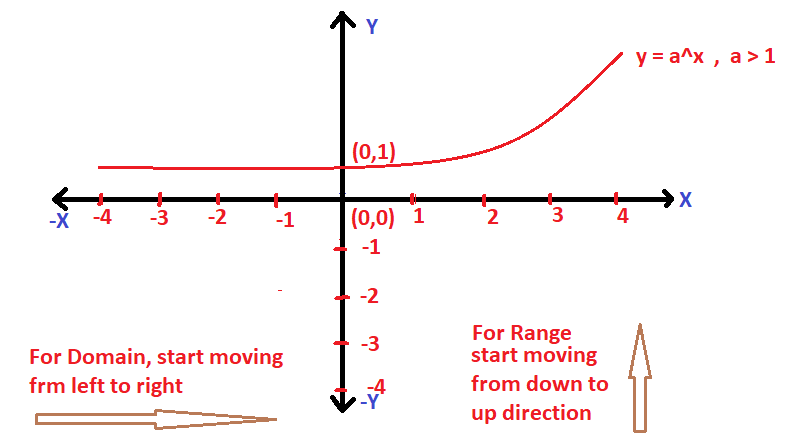
Now for an exponential function a^x , we can define this as : if a is a positive real number other than unity , then a function that associates each x ∈ R to a^x is called an exponential function . It can be given as :
f(x) = a^x where a > 0 and a ≠ 1 is called the exponential function .
Now domain of f(x) is given as R and the range of f(x) is set of all positive values of R excluding ‘0’ i.e. range = (0,∞) as it attains only positive values .
Also , f(x) = a^x value is different for different values of ‘x’ and ‘a’ , but the values for domain and range will remain the same for all the cases .
Domain And Range Of Logarithmic Function Using Graph !!
A logarithmic function can be defined by :
f(x) = ![]() for x > 0 ;
for x > 0 ;
Also just keep in mind that the logarithmic and the exponential functions are inverse of each other . Now let’s plot the graph of the logarithmic function :
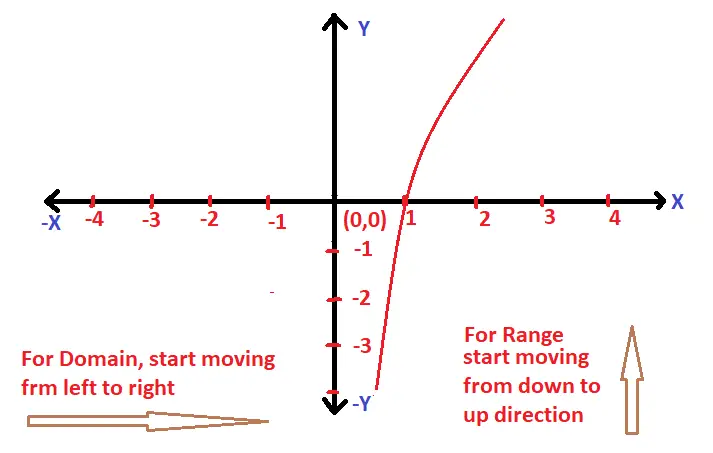
From the graph , it is pretty much evident that the domain of f(x) is set of all positive values i.e. (0,∞) and range of a logarithmic function is R (set of all real numbers)
Note : Always for determining the domain start moving from the left side towards the right direction , and for the range of function just move from the down to up direction .
Domain And Range Of A Square Root Function Using Graph !!
A square root function is defined as :
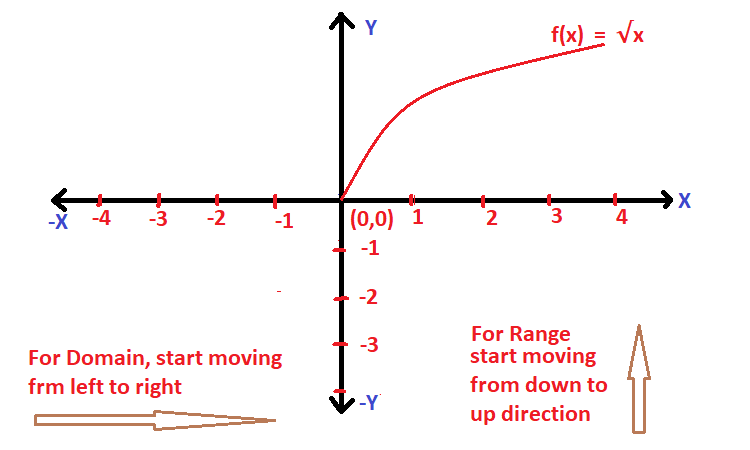
f(x) = √x and f(x) is valid for only the positive values of ‘x’
Clearly the domain of this square root function is all positive values of ‘x’ i.e. [0,∞) and range of f(x) is also [0,∞) .
Now let’s see the graph of a square root function :
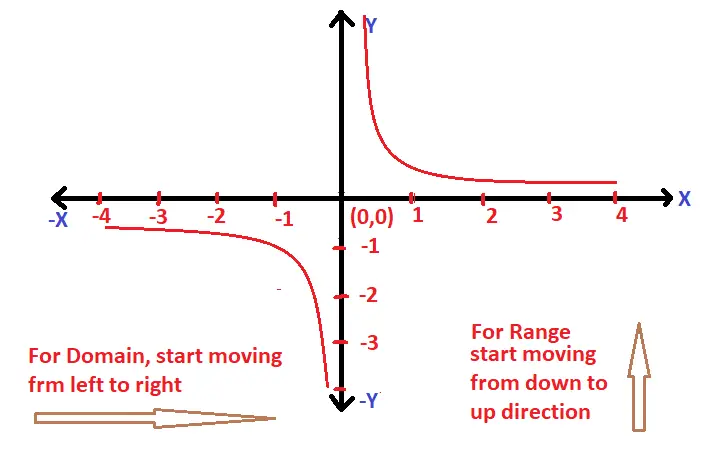
Note : Also the graph of a reciprocal function is given as :
f(x) = 1/x , clearly domain is all R except ‘0’ and range is also R – {0}
Domain And Range Of A Square Function Using Graph !!
A square function will always result in a positive value , but it can accept any values in R . The square function is given by :
f(x) = x² , is a square function .
Let’s plot the graph of f(x) as given below :
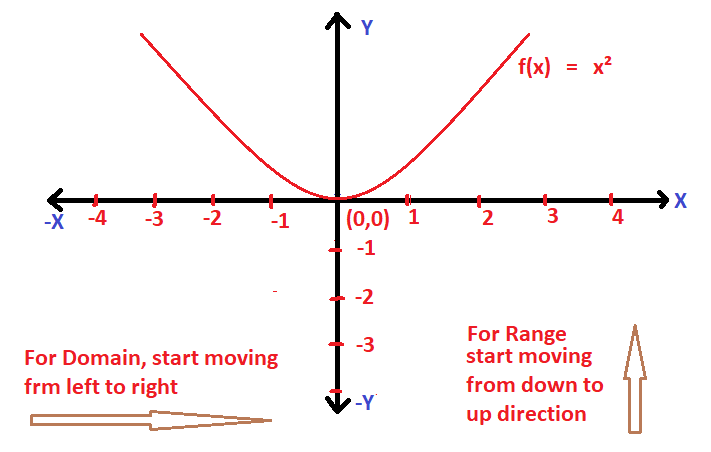
Clearly the domain of f(x) is R i.e. (-∞ , ∞) and the range of f(x) is [0,∞) , the graph of a square function is a parabola .
Now let’s try to find the domain and range of functions other than the standard function graphically . Always just keep in mind that in order to find the domain and range of a graph , you have to follow the below steps :
1. For finding domain graphically, start moving from the left side towards the right direction along the x-axis .
2. Now for finding the range of a graph , just move from the downwards direction to the upwards direction along the y-axis ,
The above two points will be clear from solving some examples to find domain and range graphically .
Let’s try to find the domain and range of a graph given below :
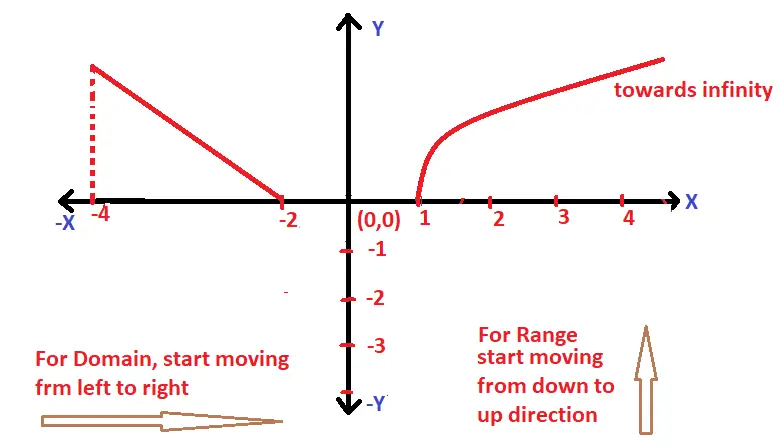
Clearly if we start moving from left to right direction , we’ll first encounter the graph of f(x) at x = -4 , then between the interval x = -2 to x = 1 , there is no graph present . Then again the graph of f(x) starts at x = 1 . Thus from all this , we can conclude that :
Domain of f(x) graphically is = [-4 , -2] ∪ [1 , ∞) ;
Now for range , we need to start moving from the downwards to upwards direction . Thus we’ll first encounter the graph at x = 0 , and also the graph will continue till infinity . So
Range of f(x) graphically is = [0 , ∞)
How To Find Domain And Range Of A Function Graphically ?
If you are given a function , the first step is to plot the graph of f(x) . Then from the graph, you just need to inspect the start and end points along the x-axis and y-axis for commenting on the domain and range value .
For eg : If f(x) = 2x + 5
Clearly the x – coordinate value (at which f(x) is ‘0’) for this function is (-5/2) respectively . So with this knowledge, we can easily plot the graph as shown below :
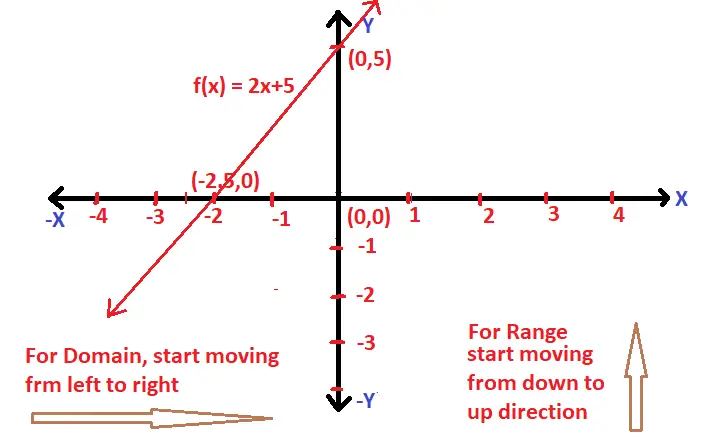
Now if we start moving from the left to right direction , the domain ranges in the interval i.e. (-∞,∞) . And for the range value , we’ll just move from the downwards to up direction along the y-axis and clearly the range is also same i.e. R
How To Find Domain And Range Of A Quadratic Function Graphically ?
Now this is interesting. Firstly you have to plot the graph of the given quadratic function i.e. a parabola shaped plot precisely . Also, the opening of the parabola will depend on the coefficient of x² in the quadratic equation .
Let say f(x) = ax² + bx + c
Now the above equation is the standard quadratic equation , we can have different shaped parabola lying anywhere in the cartesian plane depending upon the roots and sign of the coefficient of ‘x²’
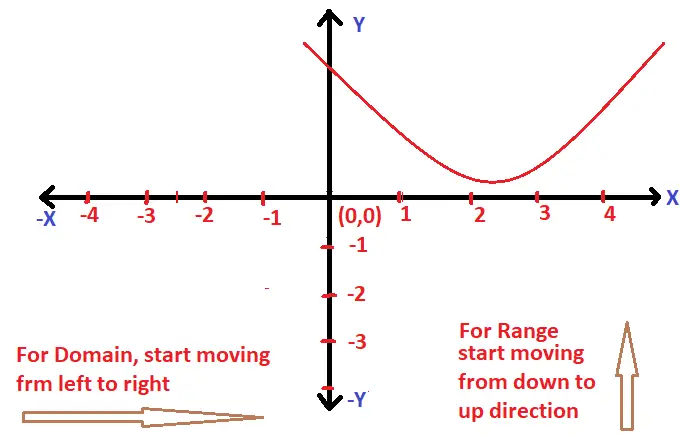
If a > 0 , then the graph of f(x) will be :
If a < 0 , then the graph of f(x) will be :
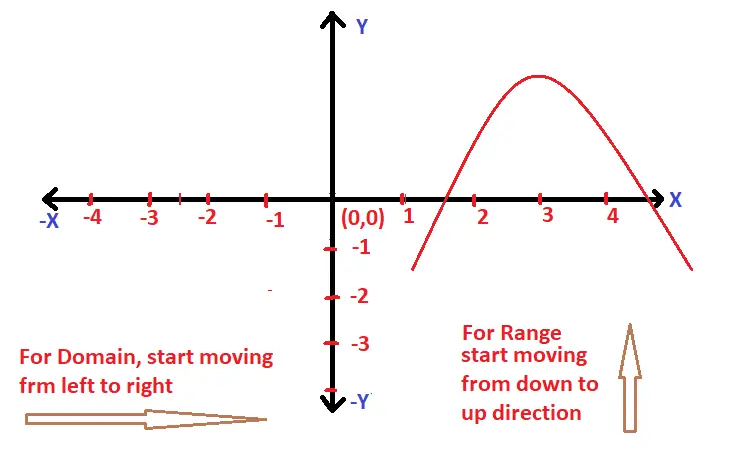
Also remember that the domain of any quadratic equation will always be R i.e. (-∞,∞) , which means that it can take any value for ‘x’ , and for the range we need to care for the start and endpoint of the quadratic equation along the y-axis . Let’s try an example now to make this concept clear :
Let’s try to find the domain and range of the function graphically :
f(x) = x² + 5x + 6
Now first we need to plot the graph , for this let’s find out the roots :
by using the middle term split up method , we can write the above function as follows :
f(x) = x² + 5x + 6 = (x+2)(x+3) = 0 ;
The roots of the above equ is the point where f(x) = 0 ;
Hence the roots will be given as x = -2 , -3 ;
Now plotting the graph for the same :
f(x) = x² + 5x + 6 ; the graph will look like as follows :
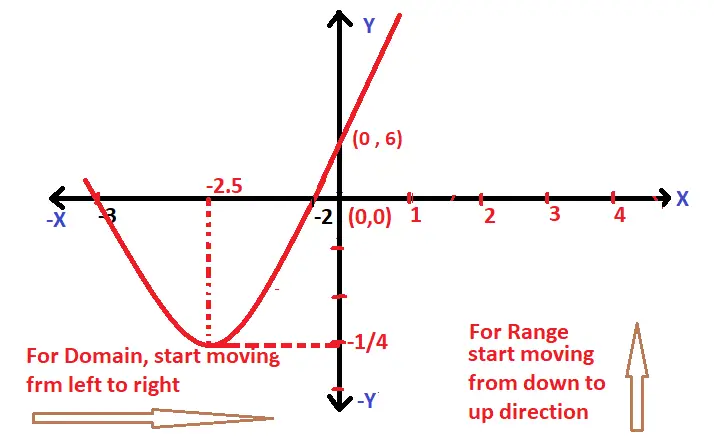
Clearly the domain is R i.e. (-∞,∞) …..(since there is no endpoint along the x-axis if we go from left to right)
Now range will be given as the points along the y-axis :
As seen in the graph , there is no endpoint of the graph in the upward direction along the y-axis. Now the start point of the graph is given as ‘vertex‘
where , the axis of symmetry = midpoint of both the roots on the number line
Also , for the y-coordinate of the Vertex of f(x) = Put the value of ‘x‘ if equ of f(x) …… (x is the axis of symmetry)
Now the graph will cut the y-axis at some point where , x = 0
f(x) = x² + 5x + 6 ;
On putting x =0 , f(x) = 6 ;
Now from the graph it is clear that the range of f(x) is given as [y coordinate of vertex,∞)
Shortcut tip : the vertex for any quadratic function can be given as the formula :
Vertex = (-b/2a , -D/4a) , where D = b² – 4ac for the equation f(x) = ax² + bx + c ;
On applying the formula , in the equation : f(x) = x² + 5x + 6 ;
a = 1 , b = 5 and c = 6 , Also D = 1
Vertex of f(x) = (-5/2 , -1/4)
The range of f(x) is [-1/4 , ∞)
I hope you really liked this post regarding the method to solve for the domain and range of a graph quickly . If you have any doubts, then do let me know the comments section. Stay tuned for more interesting stuff in this series .

Aric is a tech enthusiast , who love to write about the tech related products and ‘How To’ blogs . IT Engineer by profession , right now working in the Automation field in a Software product company . The other hobbies includes singing , trekking and writing blogs .

