How To Find Domain And Range Of A Parabola ? (Quadratic Equation With Graphs)
Domain and range of a parabola shaped graph is the first step towards finding the minimum and maximum values of any parabolic function . If you are still unaware of the basics of domain and range , you can check my previous detailed posts for sure. In this post , we’ll mainly focus on finding the domain and range of a parabola (quadratic equations) . So just sit back and read further .
How To Find Domain And Range Of A Parabola ?
Let’s understand the steps to find the domain and range of a parabola :
- Plot the graph of f(x) i.e. y = f(x) , for this you need to have the knowledge of graphs of basic maths functions
- In any graph, we can have Domain as all the x – coordinate values (along x-axis) of the graph
- And Range is all y – coordinate values (along y-axis) of the graph
- Finally you have to include/exclude the endpoints in the interval carefully by looking at the graph (for which f(x) is a valid function).
The above steps are the same for finding the domain and range of any function graphically . Moreover, there is also a readymade formula to find the minima and maxima of a quadratic function (parabola) .
You can even find the domain and range of a parabola algebraically , but for everything a basic understanding of parabolic function is necessary .
What exactly is a Parabola Function ?
The parabolic function is simply a specific type in the family of curves aong others like the ellipse , hyperbola , etc . For any parabolic function , we’ll see a common shape as the ‘U‘ shaped pattern .
The parabolic functions are related to the quadratic equations normally . You may also encounter a sideways parabola sometimes . In this post we’ll see the method to find domain and range of any parabola just by inspection quickly .
Always remember that the degree of a parabolic function will be always ‘2’.
Types Of Parabola And Its Graph !!
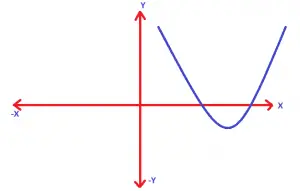
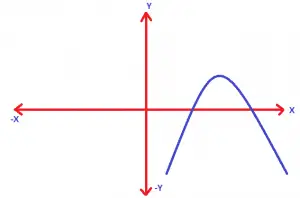
There are normally four types of parabola , i.e. a vertical and horizontal parabola indeed . In a vertical parabola , we’ll have either an Up or Down facing parabola like below :
In a vertical parabola , the upwards or a downwards opening is basically based upon the sign of the coefficient of x² in the quadratic equation .
In the equation f(x) = ax² + bx +c
for a > 0 value :
for a < 0 value :
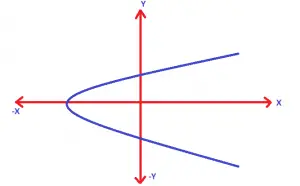
Now for horizontal parabola , we basically have a function defined in terms of ‘y’ variable i.e. :
f(y) = ay² + by + c
Again depending upon the sign of ‘a’ , the graph opening will be different :
for a > 0 value :
for a < 0 value :
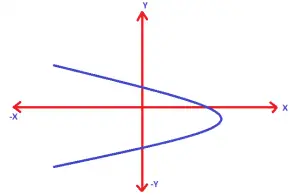
Now , hopefully the types of parabola is pretty clear to you . Lets now understand the process to solve fprdomain and range in parabolic function .
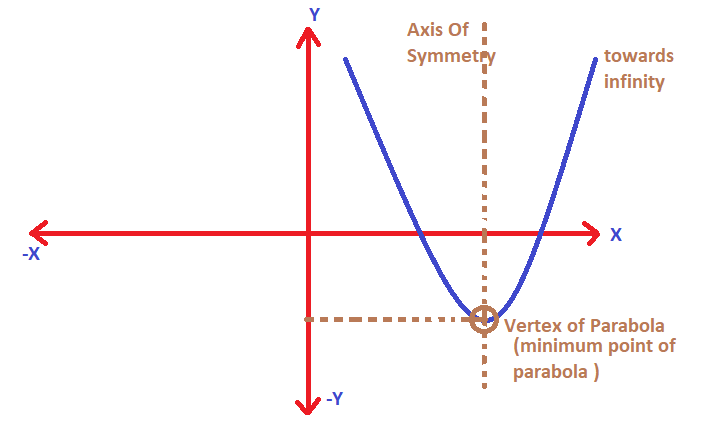
Now clearly, the minimum and maximum value of any parabola will depend upon the shape of the graph firstly . For example in an upward-opening vertical parabola, we’ll have the minimum point at the vertex of the parabola and the maximum value of the function should be always infinity as shown :
Domain And Range Of A Square Function Using Graph !!
A parabola is formed whenever we have two values of ‘x’ , that will give same value for the f(x) . Basically we are talking about the square function here .
A parabolic function will always resemble a symmetric nature along the axis of symmetry . This U shaped graph is thus due to the possible same value of ‘f(x)’ for two ‘x’ values .
First, let us understand the concept of a square function along with its graph.
A square function will always result in a positive value , but it can accept any values in R . The square function is given by :
f(x) = x² , is a square function .
Let’s plot the graph of f(x) as given below :
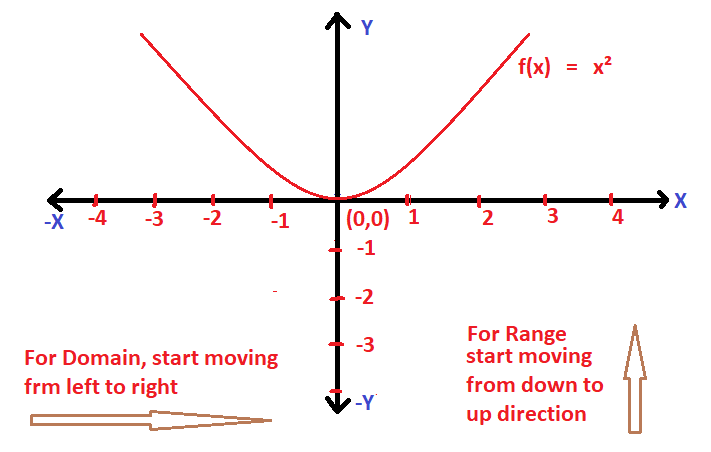
Clearly the domain of f(x) is R i.e. (-∞ , ∞) and the range of f(x) is [0,∞) , the graph of a square function is a parabola .
Now let’s try to find the domain and range of functions other than the standard function graphically . Always just keep in mind that in order to find the domain and range of a graph , you have to follow the below steps :
1. For finding domain graphically, just start to move in the direction from the Left to Right along the x-axis .
2. Now for finding the range of a graph , just move from Down to Up direction along the y-axis ,
The above two points will be clear from solving some examples to find domain and range graphically .
How To Find Domain And Range Of A Parabola (Quadratic Function) ?
Now this is interesting. Firstly you have to plot the graph of the given quadratic function i.e. a parabola shaped plot precisely . Also, the opening of the parabola will depend on the coefficient of x² in the quadratic equation .
Let say f(x) = ax² + bx + c
Now the above equation is the standard quadratic equation , we can have different shaped parabola lying anywhere in the cartesian plane depending upon the roots and sign of the coefficient of ‘x²’
If a > 0 , then the graph of f(x) will be :
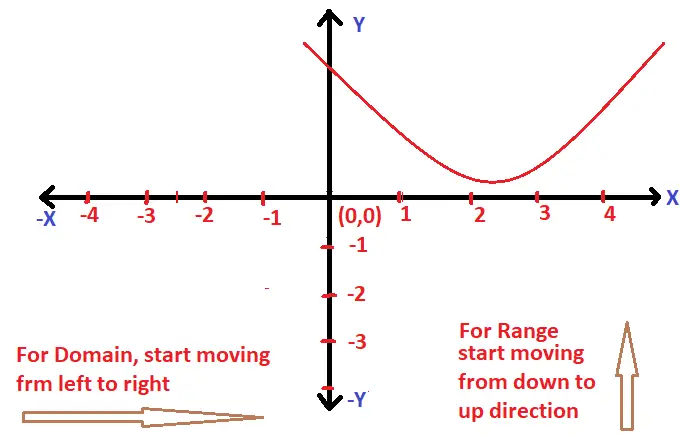
If a < 0 , then the graph of f(x) will be :
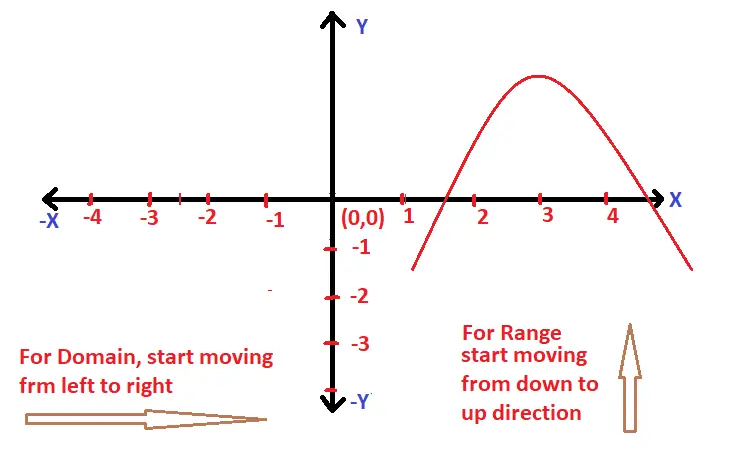
Also remember that the domain of any vertical parabolic equation will always be R i.e. (-∞,∞) , which means that it can take any value for ‘x’ , and for the range we need to care for the start and endpoint of the quadratic equation along the y-axis . Let’s try an example now to make this concept clear :
Now let us try to find the domain and range of the below parabolic function graphically :
f(x) = x² + 5x + 6
Now first we need to plot the graph , for this let’s find out the roots :
by using the middle term split up method , we can write the above function as follows :
f(x) = x² + 5x + 6 = (x+2)(x+3) = 0 ;
The roots of the above equ is the point where f(x) = 0 ;
Hence the roots will be given as x = -2 , -3 ;
Now plotting the graph for the same :
f(x) = x² + 5x + 6 ; the graph will look like as follows :
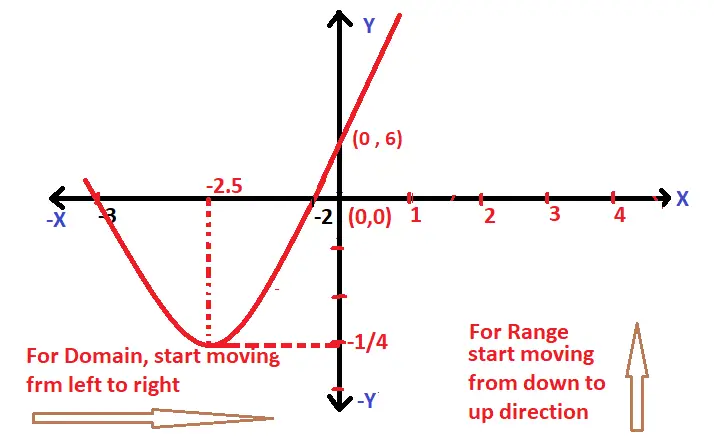
Clearly the domain is R i.e. (-∞,∞) …..(since there is no endpoint along the x-axis if we go from left to right)
Now range will be given as the points along the y-axis :
As seen in the graph , there is no endpoint of the graph in the upward direction along the y-axis. Now the start point of the graph is given as ‘vertex‘
where , the axis of symmetry = midpoint of both the roots on the number line
Also , for the y-coordinate of the Vertex of f(x) = Put the value of ‘x‘ if equ of f(x) …… (x is the axis of symmetry)
Now the graph will cut the y-axis at some point where , x = 0
f(x) = x² + 5x + 6 ;
On putting x =0 , f(x) = 6 ;
Now from the graph it is clear that the range of f(x) is given as [y coordinate of vertex,∞)
Shortcut tip : the vertex for any quadratic function can be given as the formula :
Vertex = (-b/2a , -D/4a) , where D = b² – 4ac for the equation f(x) = ax² + bx + c ;
On applying the formula , in the equation : f(x) = x² + 5x + 6 ;
a = 1 , b = 5 and c = 6 , Also D = 1
Vertex of f(x) = (-5/2 , -1/4)
The range of f(x) is [-1/4 , ∞)
For the above parabolic function , since it is vertical (upward-opening) parabola and hence a thumb rule will be that the domain of a vertical parabola will always be same i.e. (-∞ , ∞) in the number line .
Similarly, for a horizontal parabola the range will be R , as the endpoint will be ∞ in both the direction along the y – axis .
Hope you really enjoyed this post regarding the basics of parabola . Stay tuned for more interesting stuff in this series .

Aric is a tech enthusiast , who love to write about the tech related products and ‘How To’ blogs . IT Engineer by profession , right now working in the Automation field in a Software product company . The other hobbies includes singing , trekking and writing blogs .

